AI agent observability
/AI/5 min read
An agent's answer is the smallest part of what it did. Recording the rest produces far more data than ordinary logging — around seventy times more — which makes what you keep a real decision.
When an ordinary service fails, it usually says so. There is an exception, a stack trace, a non-200.
When an agent fails it typically returns a fluent, confident, wrong answer, and nothing anywhere reports a problem. The failure happened three steps earlier — a tool called with a bad argument, a result misread — and none of that is in the output.
Observability is recording those steps so that the question "why did it do that?" has an answer.
Spans and traces
A span is one operation: a model call, a tool call, a retrieval. It records what went in, what came out, how long it took, and what it cost.
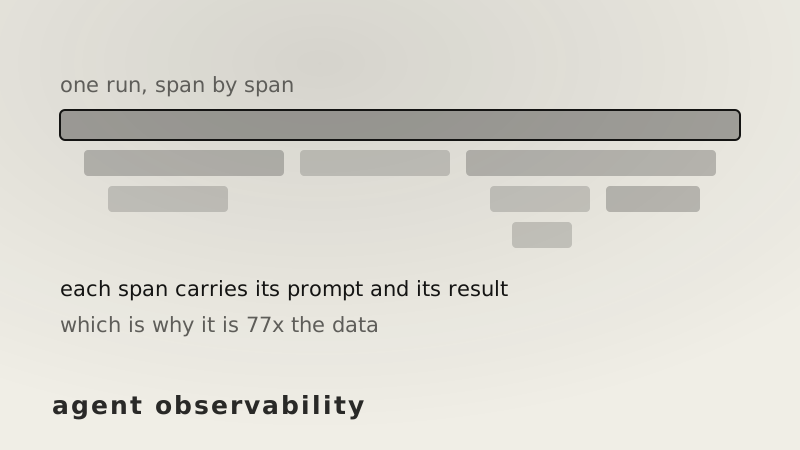
A trace is one complete run, made of many spans. Spans nest, so a trace is a tree rather than a list — a subagent's spans sit inside the parent span that invoked it.
Above traces sits the session: everything one user did across several requests.
That hierarchy is what makes the difference between "the agent gave a bad answer" and "at span 4 the search tool was called with the date in the wrong format, returned nothing, and the model treated an empty result as no availability."
What has to be in a span
The temptation is to log that something happened. That is not enough — you need what it said.
For a model call: the full prompt, the full response, which model, the token counts, the cost. The prompt in particular, because when a model behaves oddly the reason is usually visible in what it was actually sent, and reconstructing that later from application code is guesswork.
For a tool call: which tool, the exact arguments, the exact result, and whether it errored.
Plus retries, anything read from or written to memory, and the final output.
Which is why the volume is a problem
A twelve-step run logging prompts and responses is roughly 6.4 KB a step — about 77 KB for the run.
| volume | |
|---|---|
| one agent run, fully traced | 77 KB |
| 50,000 runs a day | 3.66 GB/day |
| a year of that | 1.31 TB |
| the same traffic logged conventionally | 0.048 GB/day |
That is 77 times the data per request, and it is not padding — it is the prompts and responses, which are the parts you actually need.
Keeping the useful eighth
The answer is not to log less per span. It is to keep fewer runs, chosen deliberately.
Decide after a run completes whether to store it. Keep every failure, every run that was unusually slow or expensive, every one a user complained about — and a small random sample of the ordinary successes.
| failure rate | 5% of successes kept | volume retained | failures kept |
|---|---|---|---|
| 2% | ✓ | 6.9% | 100% |
| 5% | ✓ | 9.8% | 100% |
| 8% | ✓ | 12.6% | 100% |
| 15% | ✓ | 19.3% | 100% |
At an 8% failure rate that is 3.66 GB a day down to 0.46, with every failure still on disk. The sample of successes is what tells you what normal looks like, which you need in order to recognise abnormal.
Sampling before the run — the cheaper thing to implement — throws away failures at the same rate as successes, which defeats the point.
Why this is not ordinary monitoring
Nothing crashes. Conventional monitoring watches for errors. An agent's characteristic failure produces no error at all, so error rate is close to useless as a health signal. Task success rate is the metric, and it cannot be computed from the trace alone — something has to judge whether the answer was right.
The path changes every run. The same request twice produces different traces. Two runs cannot be diffed the way two identical code paths can, so comparison has to be statistical rather than per-run.
Cost is a first-class signal. A run that succeeds but takes forty steps and two dollars is a problem that no traditional metric surfaces. Tokens, cost and step count belong on the dashboard beside latency.
The practical bits
Instrument first. Adding tracing after something has gone wrong means the run you needed to see was not recorded.
Mask before storing. Prompts contain whatever the user typed, and tool arguments contain whatever was looked up. Both routinely include personal data, and a trace store is a copy of all of it.
Alert on drift, not just errors. Cost per task rising, step count rising, tool success rate falling — these move before anyone files a complaint.
Keep old traces. Answering "when did this start?" needs history, and by the time the question is asked it is too late to begin collecting.
And note the boundary: this tells you what the agent did. Whether what it did was any good is a separate judgement, made on top of this data. Traces without that judgement are a very detailed record of unknown quality.
The short version
- Agents fail silently, so the answer alone cannot explain a failure.
- A span is one operation; a trace is a full run; spans nest into a tree.
- Spans must carry the actual prompts, responses, arguments and results — not just event names.
- That makes agent tracing about 77× the volume of conventional request logging.
- Sample after the fact: keep all failures plus a few percent of successes, and 12.6% of the data retains every failure.
- Error rate is a weak signal because nothing errors; task success rate is the real one.
- Traces change every run, so comparison is statistical.
- Mask personal data before storing, and instrument before you need it.